


Dashboard Real-Time Safety Insights at a Glance
The SAFORA Dashboard is a modern, visually intuitive digital interface that provides a comprehensive overview of safety performance across the organization. With role-based dashboards, users receive the most relevant information for their responsibilities, ensuring clarity, focus, and faster decision-making.
What is the SAFORA Dashboard?
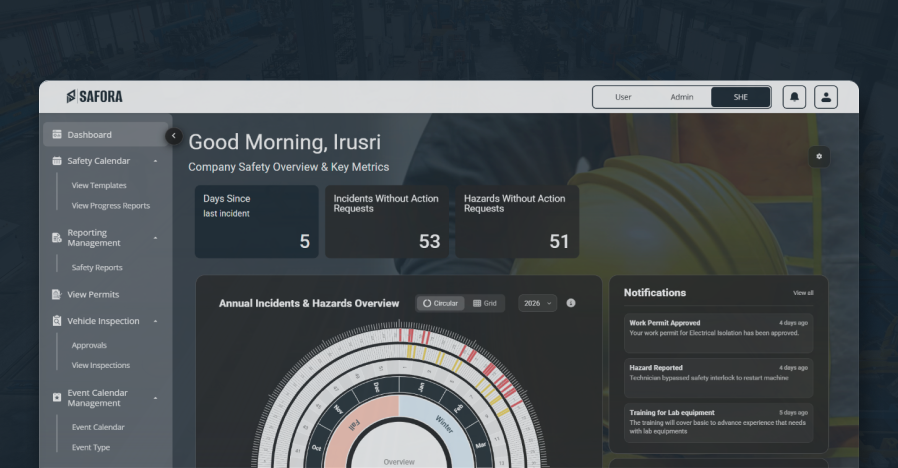
The SAFORA Dashboard consolidates critical safety data into a single view, delivering real-time insights and summarized safety metrics. It transforms raw safety data into meaningful statistics, helping organizations monitor performance, identify risks, and take proactive action.
For general users, the dashboard presents personal safety performance and assigned actions. For EHS users, it displays overall organizational safety performance, offering full visibility into incidents, hazards, and trends.
Why Role-based Dashboards?
Different users require different views of safety data. SAFORA provides role-based dashboards to ensure that:
-
Personal Safety Performance Employees see their personal safety performance and responsibilities at a glance.
-
Team Visibility Supervisors gain visibility into their team's safety status and performance metrics.
-
Organization-wide Insights EHS users access organization-wide safety insights and comprehensive analytics.
-
Strategic Overview Management can review trends and performance indicators for strategic decision-making.
How the SAFORA Dashboard Works
A powerful real-time safety intelligence center


Real-Time Data Display
The dashboard displays real-time safety data collected from hazard reports, incident reports, inspections, and work permits.
Visual Safety Metrics
Safety information is presented using charts, graphs, and key indicators to make data easy to understand and analyze.
Quick Insights for Action
Users can instantly identify high-risk areas, increasing safety trends, and overdue corrective actions. This enables proactive and informed decision-making.
Benefits
SAFORA's Dashboard provides comprehensive, real-time visibility into your organization's safety performance, enabling proactive risk management and data-driven decision-making.
-
Real-Time Safety Visibility Instantly monitor incidents, hazards, and safety activities across the organization through a single centralized dashboard.
-
Faster Decision-Making Visual charts and key safety metrics help teams quickly identify risks and take informed actions.
-
Proactive Risk Management Identify high-risk areas and emerging safety trends early to prevent incidents before they occur.
-
Personalized Safety Insights Role-based dashboards ensure users see the most relevant safety information for their responsibilities.
-
Improved Accountability Track assigned actions and overdue tasks to ensure timely completion of safety responsibilities.
-
Centralized Safety Monitoring Consolidate safety data from incidents, hazards, inspections, and work permits into one unified view.
-
Clear Safety Communication Visual data representation makes safety performance easy to understand for employees, supervisors, and management.
-
Trend Analysis for Continuous Improvement Monitor incident and hazard trends over time to support long-term safety improvements.
Key Features
-
Role-based Dashboards Customized dashboards for different user types, showing the most relevant information for their responsibilities
-
Real-Time Safety Data Live updates and insights from across the organization, ensuring timely awareness of safety status
-
Visual Charts and Widgets Intuitive visual representations making complex safety data easy to understand and analyze
-
Department-wise Distribution View incident and hazard distribution across departments to identify high-risk areas
-
Trend Analysis Yearly incident and hazard trends to monitor safety performance over time
-
Interactive Filters Filterable widgets allowing users to drill down into specific time periods, departments, or incident types